The dashboard is the first screen you see when you sign in to SeatFun. It shows how your events are selling and gives you one-click access to every part of your account.
Go to app.seatfun.com/dashboard and sign in. You can return here at any time by selecting Dashboard at the top of the left menu.
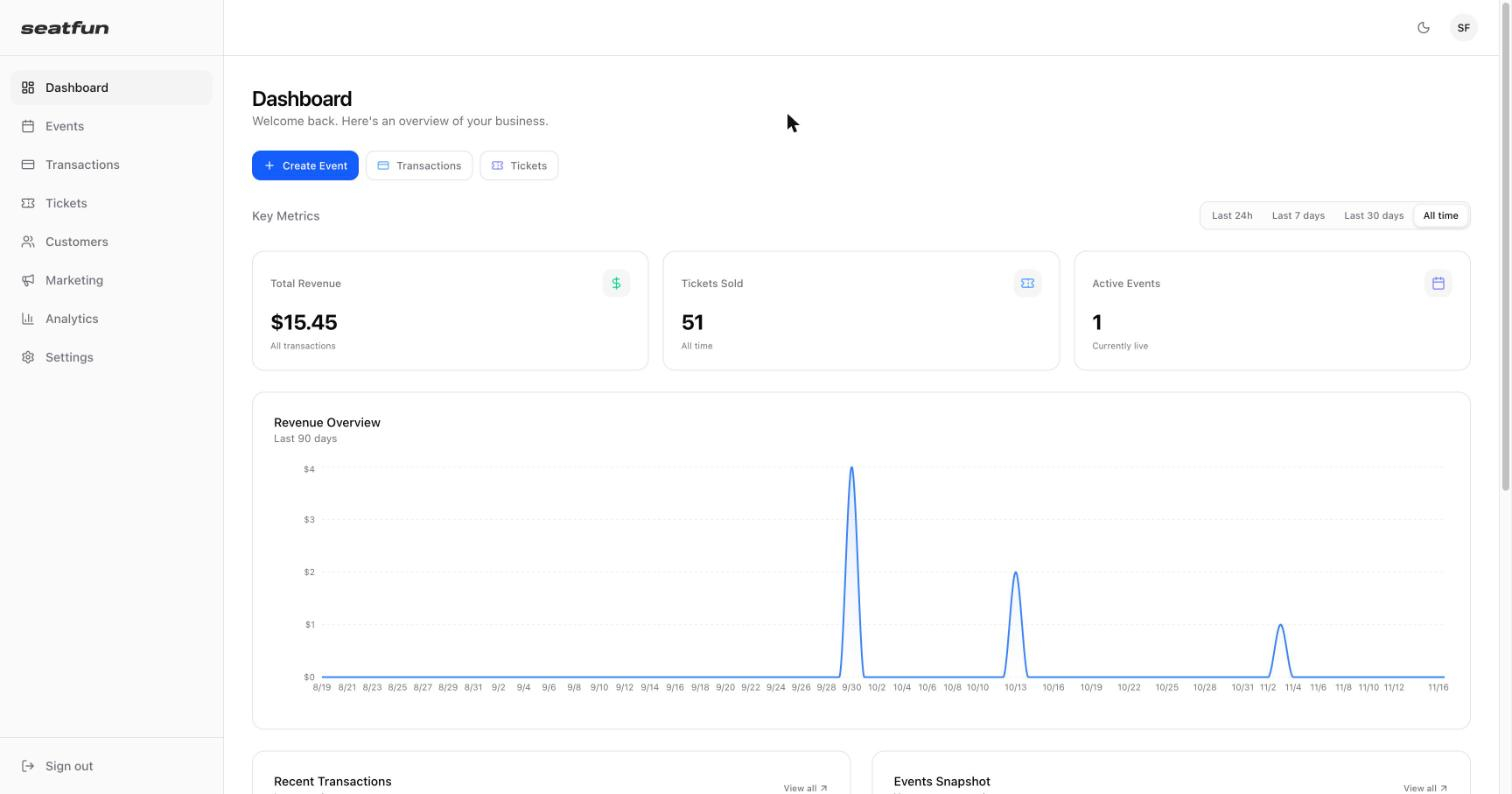
The menu on the left is available on every screen. Each item opens one area of your account.
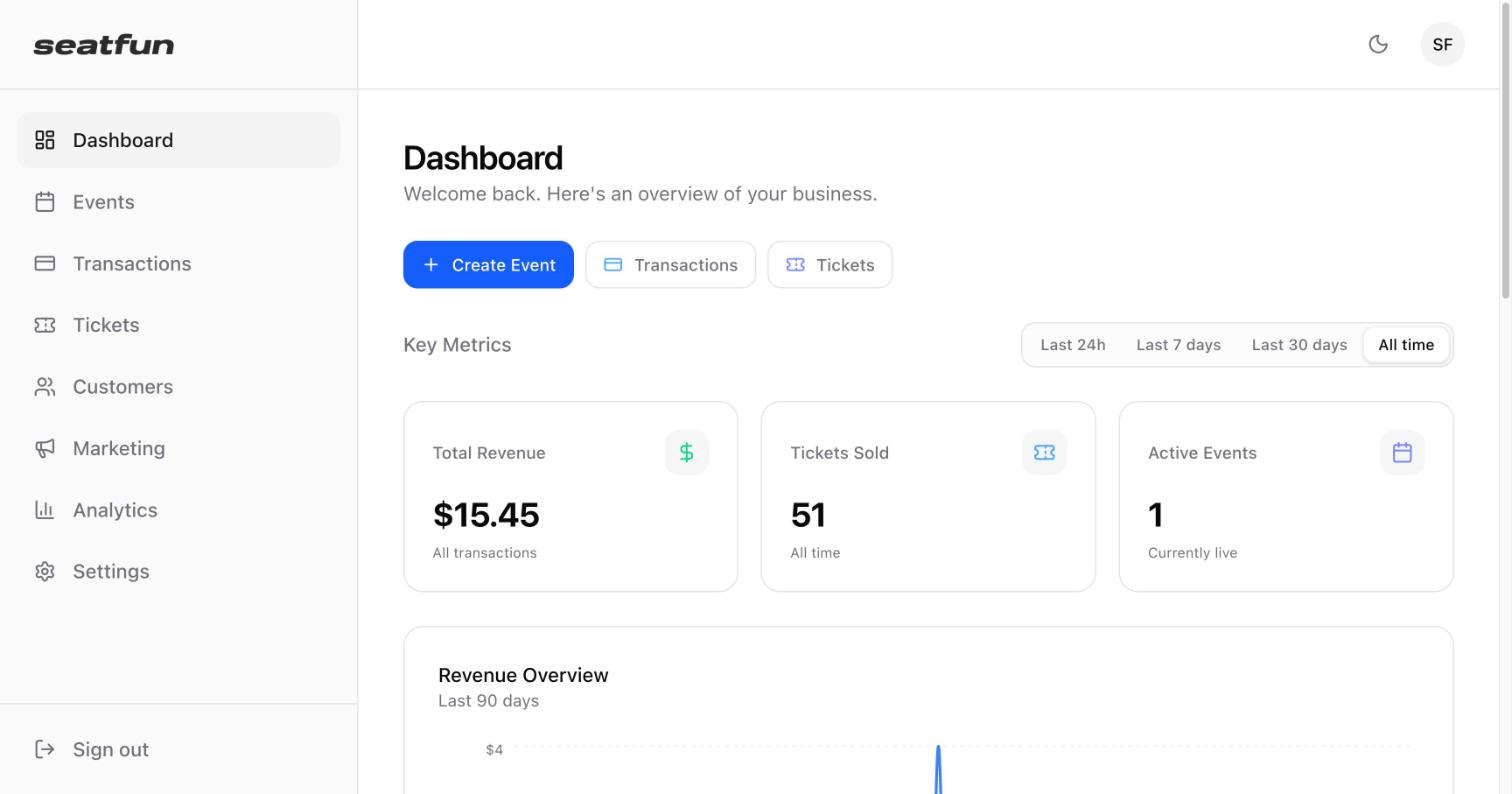
Menu item | What you do there |
|---|---|
Dashboard | See revenue, tickets sold, recent orders, and your events at a glance. |
Events | Create and manage events, ticket types, seating, and discount codes. |
Transactions | Review every order and payment, search and filter them, and export to CSV. |
Tickets | Look up issued tickets and see which have been checked in. |
Customers | See who buys from you, how much they spend, and who comes back. |
Marketing | Create tracking links, send email blasts, embed ticket widgets on your website, and manage add-ons. |
Analytics | Compare revenue by event, follow sales over time, and see which sales channels orders come from. |
Settings | Manage your profile, organization details, Stripe payments, team members, tracking pixels, notifications, and box office printing. |
Three buttons sit under the page title so you can jump straight to the most common tasks.
Create Event opens a new event form.
Transactions opens your full list of orders.
Tickets opens your issued tickets.
The Key Metrics row summarizes your account in three numbers.
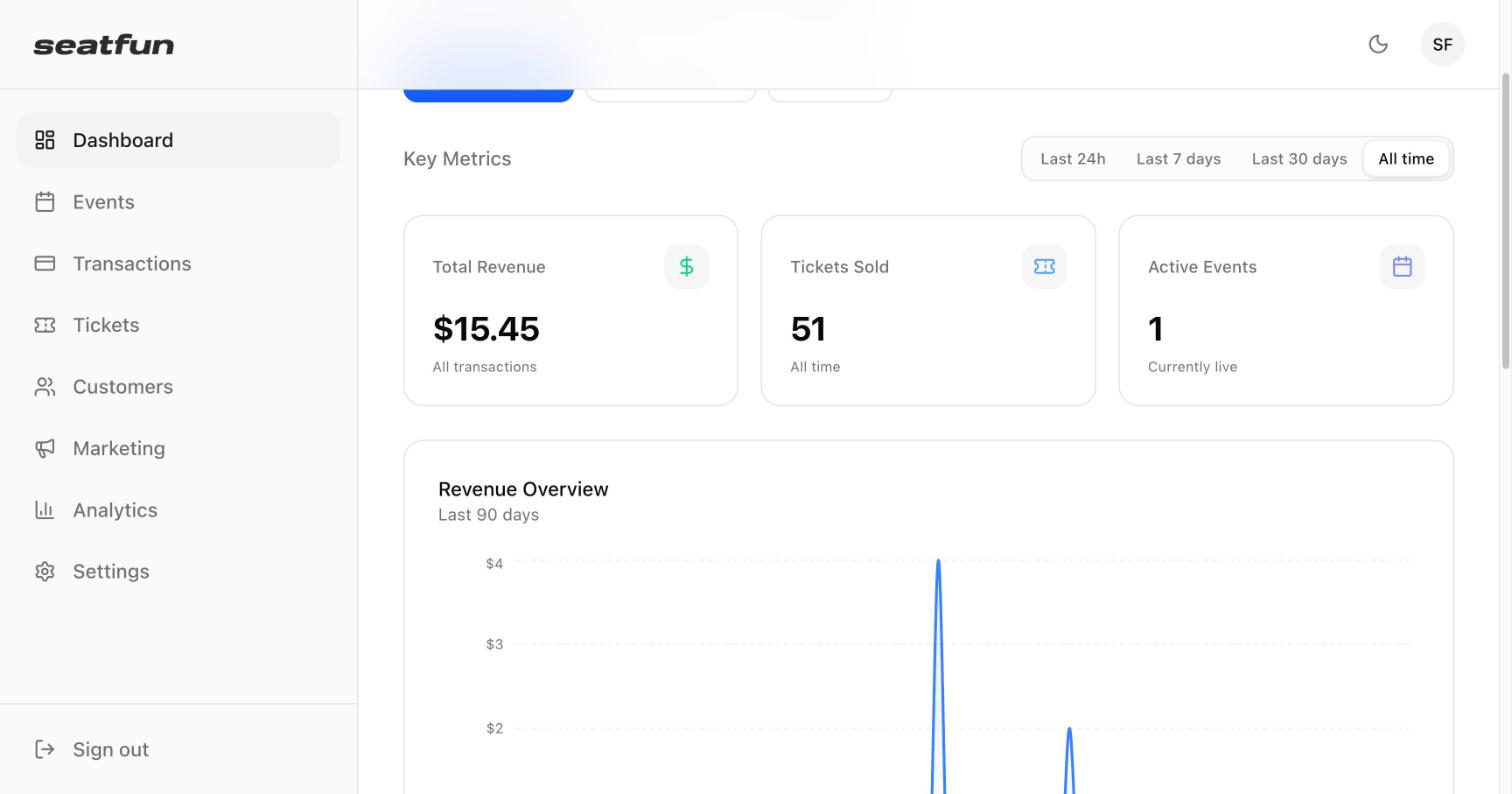
Metric | What it shows |
|---|---|
Total Revenue | Money collected from ticket sales in the selected time range. |
Tickets Sold | Number of tickets sold in the selected time range. |
Active Events | Events that are currently live and on sale. |
Use the buttons on the right to change the time range: Last 24h, Last 7 days, Last 30 days, or All time. The Revenue Overview chart below the metrics updates to match. Hover over any point on the chart to see the revenue for that day.

Scroll down to find two lists.
Recent Transactions shows your latest orders with the buyer's email, order number, ticket count, amount, and payment status. Select View all to open the full Transactions list.
Events Snapshot lists your events with their status, date, tickets sold, and revenue. Select View all to open the Events list.
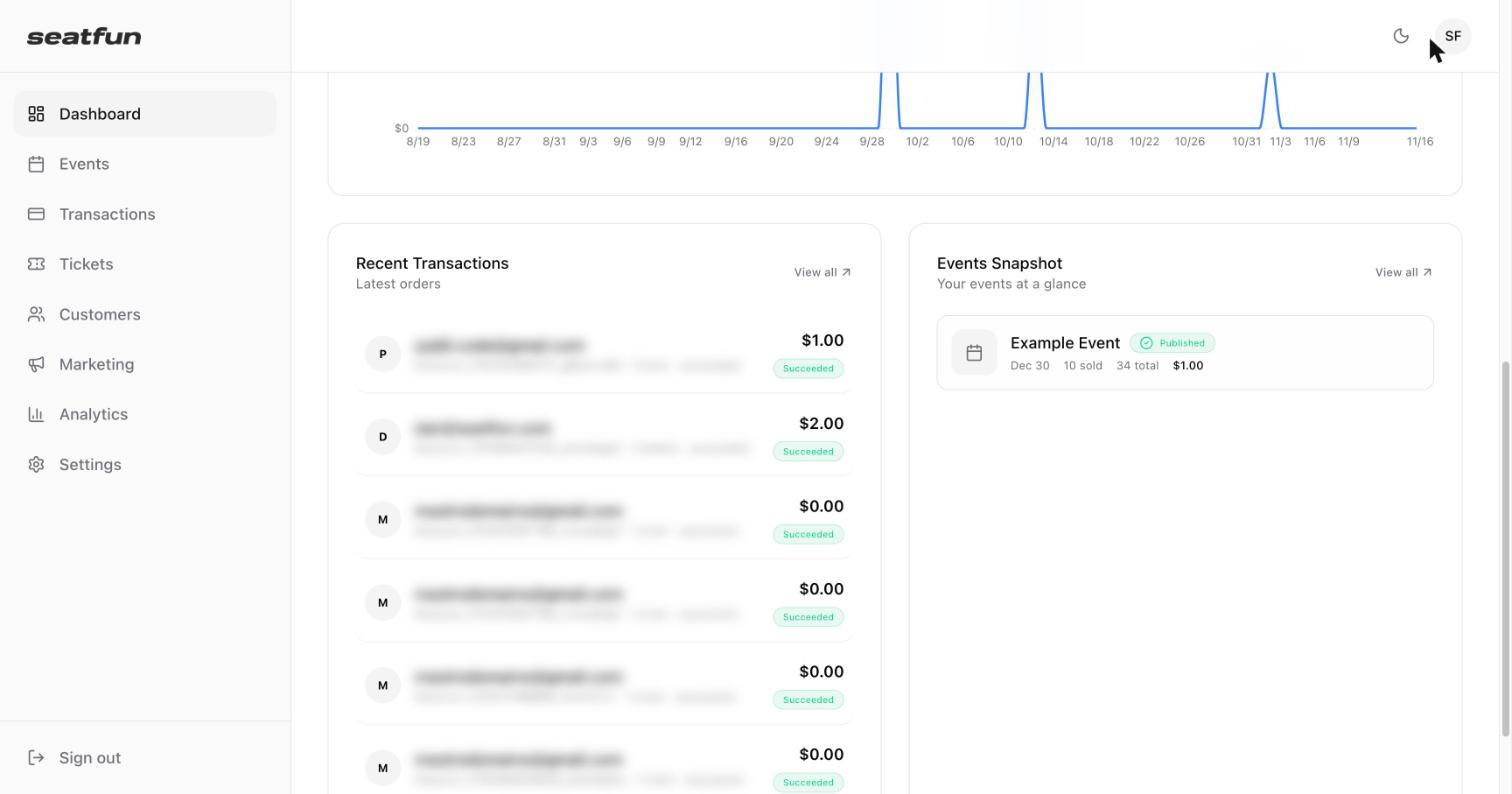
Two controls sit in the top right corner of every screen.
Select the moon icon to switch between light and dark mode.
Select the circle with your organization's initials to open a menu with Settings and Sign out.
You can also sign out from the bottom of the left menu.
