
The Analytics page brings together performance across all of your events. Use it to see which events earn the most, how sales are trending, and where orders come from.
Open Analytics
In the left menu, select Analytics.
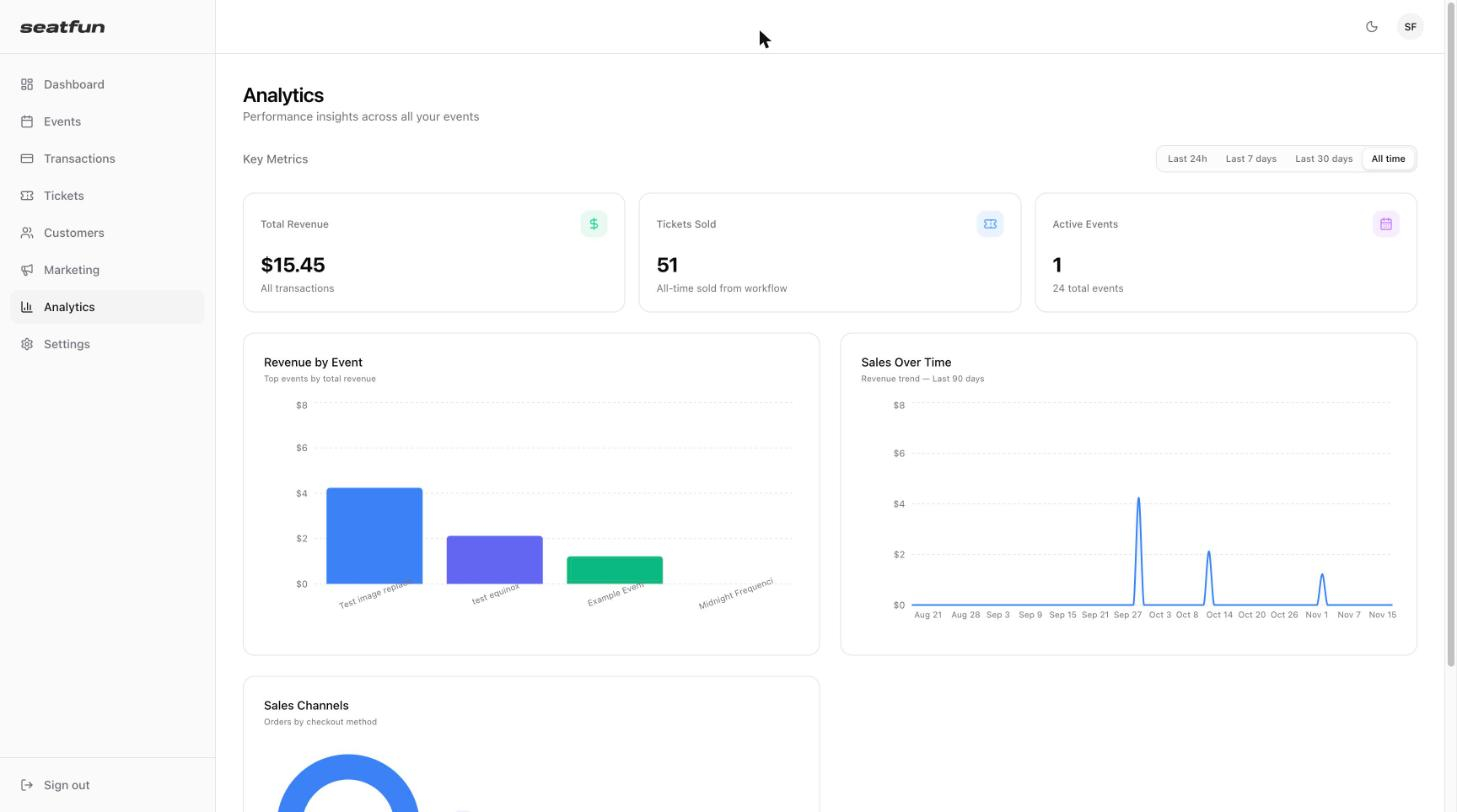
Key metrics
Metric | What it shows |
|---|---|
Total Revenue | Money collected from all transactions in the selected time range. |
Tickets Sold | Number of tickets sold. |
Active Events | Number of events currently live, with your total number of events underneath. |
Use Last 24h, Last 7 days, Last 30 days, or All time in the top right to change the time range.
Charts
Chart | What it shows | Use it to |
|---|---|---|
Revenue by Event | A bar for each of your top events by total revenue. | Compare events and see which ones earn the most. |
Sales Over Time | Your revenue trend as a line over time. | Spot sales spikes after an announcement, email, or promotion. |
Sales Channels | Orders split by checkout method, such as web. | See how much you sell online compared with other channels. |
Hover over a bar or a point on a chart to see its exact value.
Where to find more detail
One event: Open the event's Command Center. The Overview tab shows revenue, tickets sold, and check-ins for that event.
Individual orders and fees: Go to Transactions to see every order and the Stripe fees on each one.
Buyers: Go to Customers to see repeat buyers and top spenders.
Campaign results: Go to Marketing and open Tracking Links to see page views, transactions, and revenue for each link.